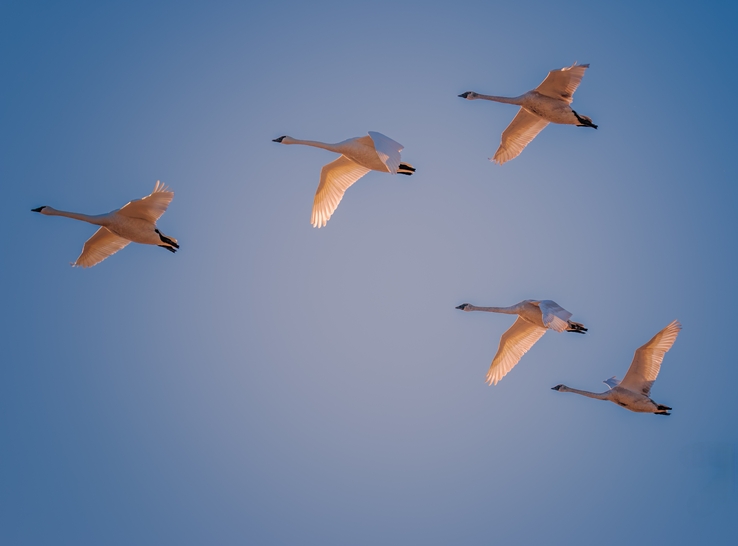
A new online tool called the Waterfowl Alert Network notifies poultry farms when the risk of a highly pathogenic avian influenza (HPAI) outbreak is high. The tool uses waterfowl densities to determine potential risk because waterfowl are reservoirs of HPAI.
“There are other tools to track HPAI outbreaks, but not a lot of tools for surveying waterfowl,” reported Tristin Bond, AgriNerds, Inc., at the 2023 North Central Avian Disease Conference.
Poultry producers can use this information to help steer biosecurity and husbandry decisions that reduce the risk of HPAI outbreaks.
High-tech surveillance
The Waterfowl Alert Network is subscription-based and operates from November through March when waterfowl densities are highest in North America. It was designed by AgriNerds, a University of California–Davis spinoff company.
“The computer models we use are for roosting, which represents a larger proportion of the daily schedule of the waterfowl than feeding flight,” Bond said. “We also have one of the highest resolutions in our modeling where each pixel is a 250-meter square compared to 1-kilometer square.”
The tool uses data from 25 NEXRAD radar weather stations located in 15 states and three flyways to survey waterfowl densities. Data from several other remote sensing models is also used.
Currently, the network’s computer models cover California, the Midwest, Northeast, and a few small areas in between.
For a presentation at the 2023 International Poultry Scientific Forum,1 the technology’s creators modeled data on wild birds for more than 450 farms in the Mississippi and Atlantic Flyways — key waterfowl-migration routes.
It showed that the greatest density of the birds in November 2022 was in the upper Mississippi Flyway, with the lowest in the Northeastern Plains and northeast of the Appalachian Mountains.
HPAI-outbreak readiness
The tool generates daily alerts for poultry farms that ranks farm sites with the highest risk of HPAI outbreaks. The software also allows farms to sort and understand waterfowl density near their locations on daily, weekly, monthly, and seasonal levels in a radius of 1, 2 and 3 kilometers.
In addition to guiding biosecurity plans, this information can help direct new production units away from areas with historically high densities of waterfowl.
“If we’re dealing with this new world of avian influenza being somewhat ubiquitous in North America and beyond, we’ll probably want to be a little more thoughtful about where we grow our poultry, making sure that we’re trying to thread that needle of food production and also allowing waterfowl habitat,” said Maurice Pitesky, DVM, PhD, of UC–Davis.
In an ideal world, the system would be as accessible as weather data, he suggested, with partial funding by government and industry as a possible route to achieving this.
“One of the things that we’re doing are some machine-learning-based algorithms, where we can look at these external waterfowl-abundance data and also the farm-biosecurity husbandry data — things like ventilation systems, for example — and then come up with statistical models that identify what are the best internal and external predictors of a farm popping with avian influenza,” he added.
For more information, visit Waterfowl Alert Network.
1 Pitesky M, et al. CO2 Using the Waterfowl Alert Network to Model Waterfowl Density Near Commercial Poultry in the Atlantic Flyway and Beyond. International Poultry Scientific Forum, 2023, Atlanta, USA.


